With the release of the Gear VR virtual reality headset by Samsung and Oculus, it feels like the future is here. It’s easy to see how a number of industries are going to be disrupted by this new media format over the next few years by virtual reality, including video gaming, film, and marketing – imagine an architect letting you tour around a design instead of just showing you a blueprint.
But what about data science? The applications are much less clear than in entertainment and marketing, but it’s likely that virtual reality will enable some interesting new data visualizations that 2D images, even interactive ones, don’t provide.
You might be thinking, “Hey wait, is this just going to be like a silly-looking 3D bar chart?” Making good data visualizations is nontrivial. There are a ton of design and user experience issues that need to be figured out for VR, just like 2D interactive visualizations, which have come a long way through projects like D3.js, ggplot2, seaborn, plot.ly, and many others. We’re not going to get practical VR visualizations in one post, but let’s take a few tiny steps in that direction.
Oculus has done some amazing work setting up tools for developers. For example, to build full-fledged interactive VR apps, one can use two of the most popular game engines (Unity and Unreal). That’s probably the way to go in the long run for VR visualizations since they allow for much more interactivity, but Oculus also has included a very nice little app in the form of Oculus 360 Photos that allows you to view static 360-degree images. “Static” or “non-interactive” are perhaps not great terms here since a static image in VR wraps completely around you. You can look in any direction, and you’ll see a different part of the scene. However, you can’t move around (like an app), and the scene doesn’t change or move (like a video).
The 360-degree photos can also be stereoscopic, meaning that there’s one view for your left eye and another for your right, creating a sense of depth to the images, similar to a 3D movie (but at least to me, much more convincing). (Aside: unfortunately, a lot of VR content currently available, particularly video, is not stereoscopic. Hopefully better tools and cameras will make this cheaper and easier.)
Image formats for VR
I’m going to focus on stereoscopic images, but hopefully some of the ideas are applicable to videos and apps. So… a stereoscopic 360-degree image? That must require some crazy proprietary format that only exists for the Gear VR and will never be used for anything else, right? Wrong. Actually, one of the 3D-to-2D projections that works with Oculus’s software, the equirectangular projection, was invented around 2,000 years ago by Marinus of Tyre, and images using this projection can be saved as PNG files, invented slightly later in 1996.
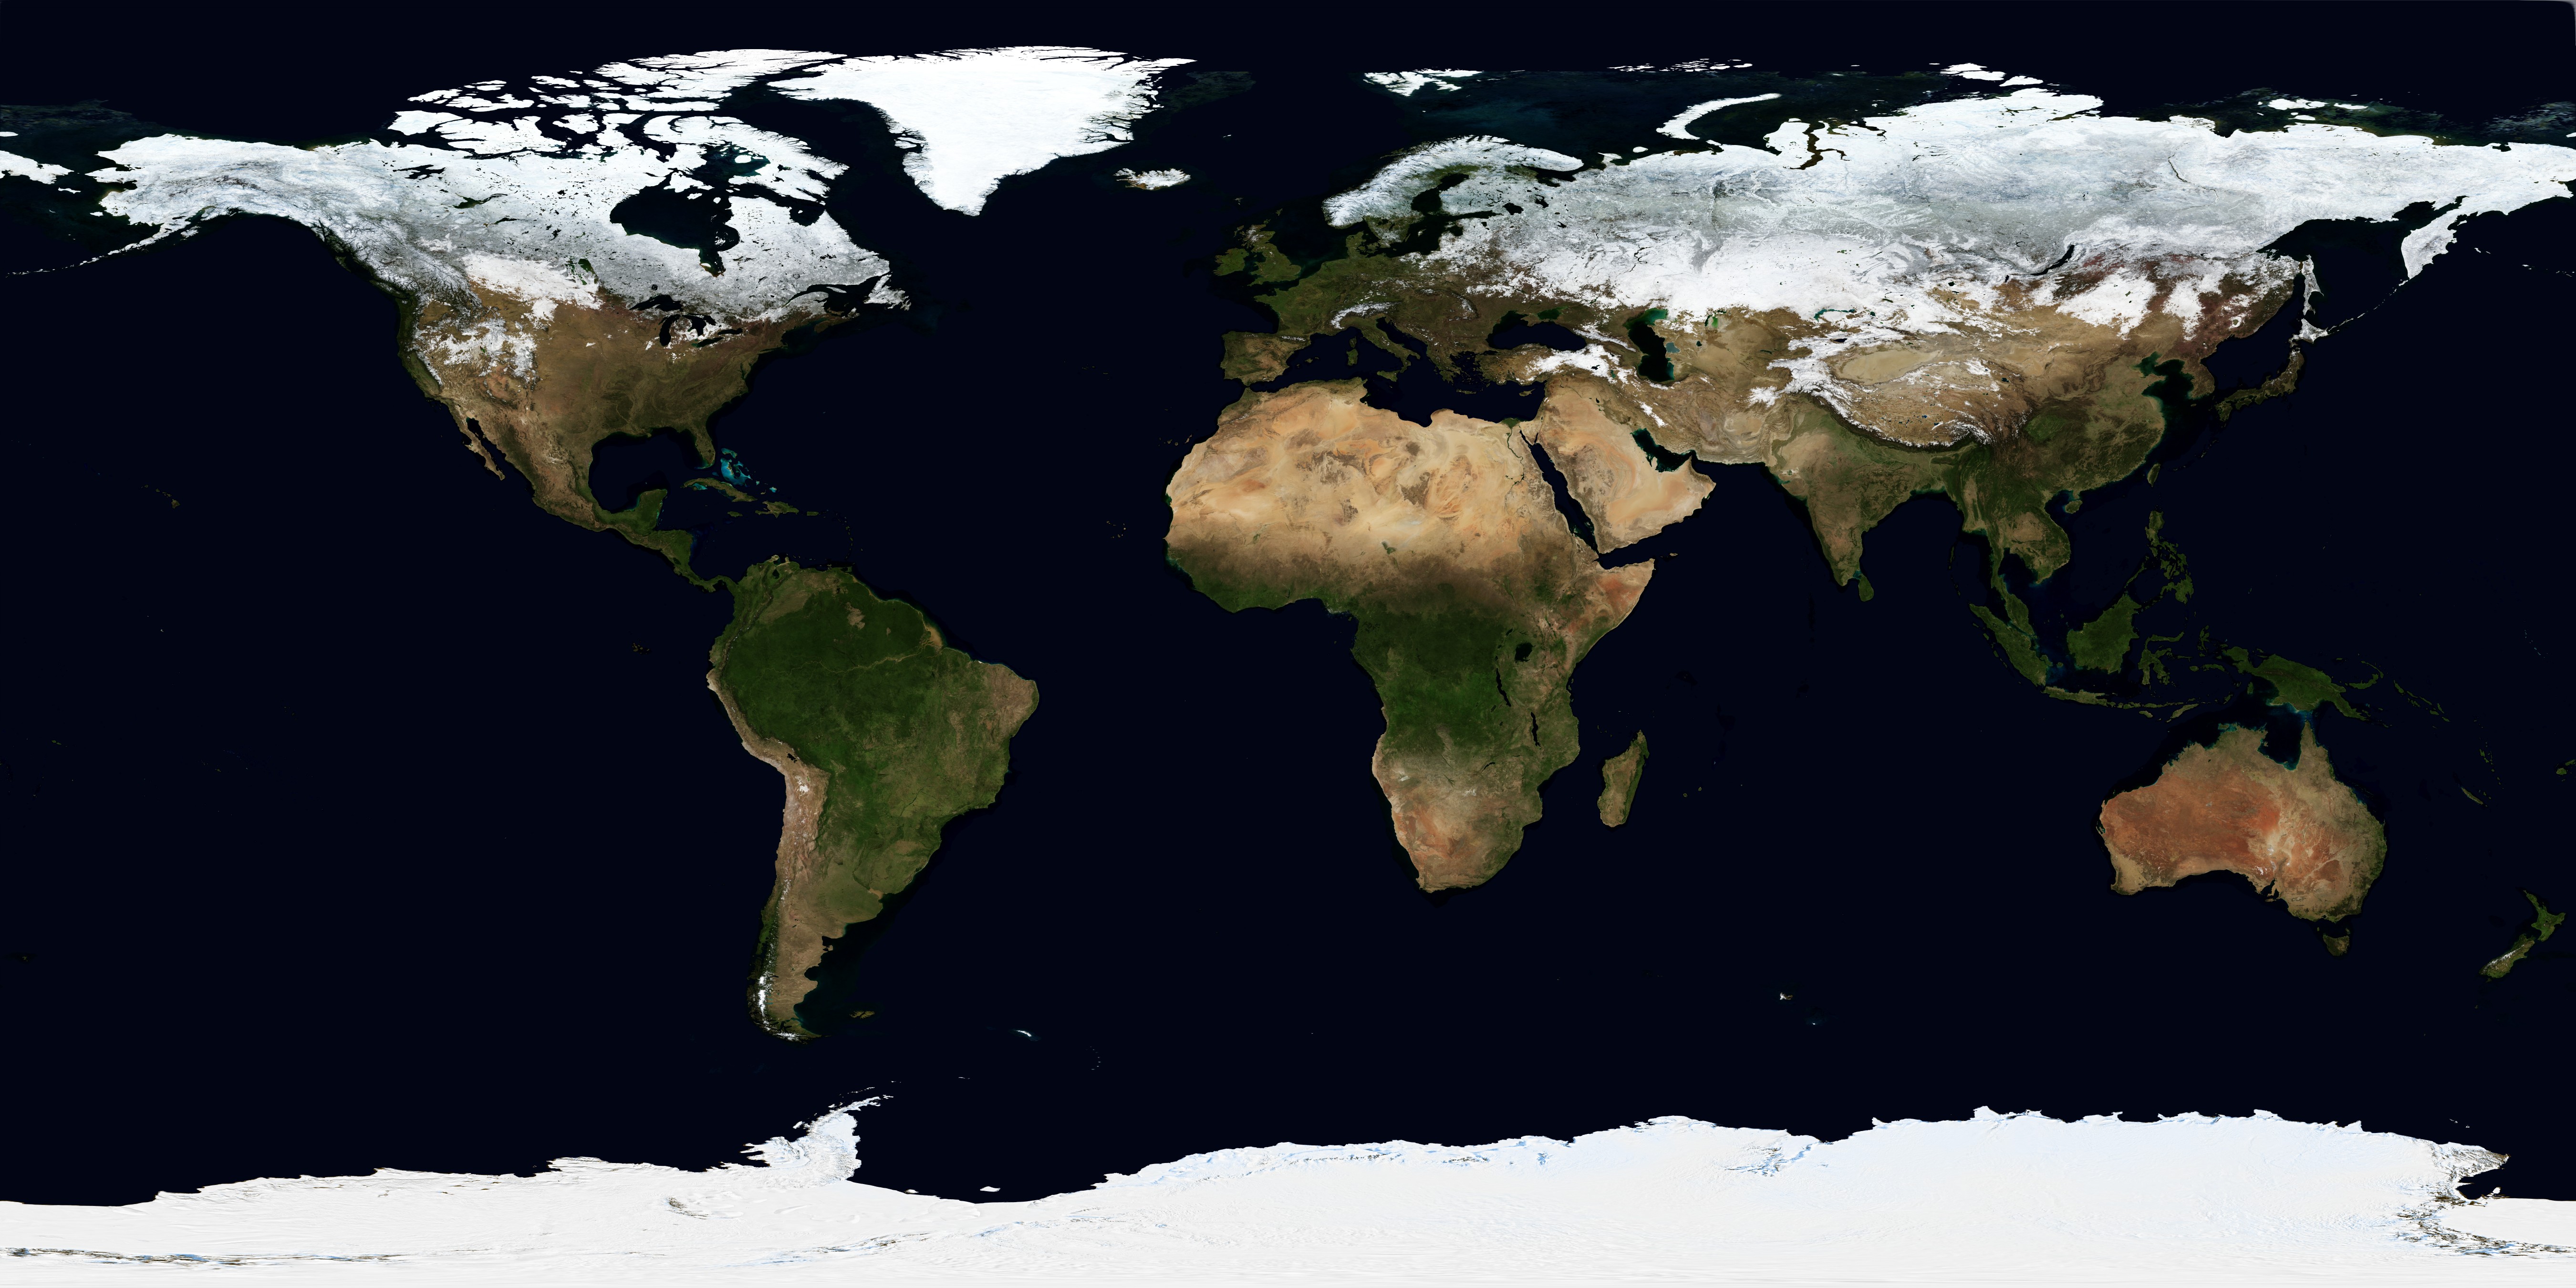
In fact, such equirectangular projections are not so hard to find. Many world maps use this projection, like this one from “NASA’s Earth Observatory” (others are here).
Loading up an equirectangular PNG file into the Gear VR is pretty easy. See these instructions).
An aside about map projections: equirectangular projections, and other 2D map projections, cause visualize distortions. In fact, the best possible projection is to some extent a matter of debate. For example, in an equirectangular projection, Africa appears much smaller than it really is because it is along the equator, and Europe appears relatively larger because it’s further from the equator. When viewing the globe in 3D, however, there are no such distortions. Of course, if you load up a world map in Gear VR, you’re looking at Earth’s surface as if from the inside of a sphere, but it’s a much more accurate (and impressive) representation of our planet than a 2D image.
Rendering a Simple Example
OK, back to data visualization. How can we render an equirectangular projection of a 3D visualization of some data? Again, my first thought was that it would require some fancy piece of 3D modeling software, which can cost thousands of dollars per year. However, the open-source community comes to the rescue. The latest release of Blender (2.76b) actually has built-in support for rendering equirectangular projections (cube maps are probably a better projection for VR, and Oculus’s viewer software supports them, but Blender doesn’t at the moment, to my knowledge). Also, a lot (perhaps most) of the things one can do in Blender’s GUI are accessible through Blender’s amazing Python API. It’s easy to make a scene with some basic lighting and the right camera setup for VR rendering within the GUI, save it (as a .blend file), and then use a Python script to load that file up, add cubes, spheres, etc. for data, and finally render a PNG image as output. Blender also has support for outputting stereoscopic image files in a format that Oculus’s software supports (one equirectangular projection for each eye, either side-by-side or up-and-down, in a single PNG file).
First, let’s just plot some points as cubes. The base Blender scene just has a couple basic light sources and a camera slightly offset from center and a few settings for stereoscopic equirectangular output (see notes below). The following Python code generates some artificial data points from a 3D normal distribution and places a cube according to the implied x, y, z coordinates. It can be run with blender --background --python make_stereo_3d_image.py.
import bpy
from numpy.random import RandomState
import numpy as np

bpy.ops.wm.open_mainfile(filepath="stereo_equirectangular_base.blend")

count = 200
rs = RandomState(1234)

min_pt = 0
max_pt = 10
cube_size = 0.1

# Generate some data from a multivariate normal distribution
# (http://stackoverflow.com/questions/16024677/generate-correlated-data-in-python-3-3)
mu = np.array([0.0, 5.0, 5.0])
r = np.array([[5.5, 0.3, 4.3],
              [0.4,  1., 0.5],
              [4.8, 0.5, 5.0]])
data = rs.multivariate_normal(mu, r, size=count)
print(data)

for x, y, z in data:
    print("xyz", x, y, z)
    bpy.ops.mesh.primitive_cube_add(location=(x, y, z))
    bpy.ops.transform.resize(value=(cube_size, cube_size, cube_size))

bpy.data.scenes['Scene'].render.filepath = 'output.png'
bpy.ops.render.render(write_still=True)
That gives us a nice little image file that can be loaded into the Gear VR.
Visualizing the Data Science Social Network
Artificial data is nice for a simple example, but what about something a little more real? Well, we’re doing a lot of research on social media at Civis, and one of the datasets we’ve put together for development has tweets and profile information for Twitter users who tweet about data science, “Big Data,” machine learning, etc. One thing we’re exploring with such data is how to cluster users into communities and then visualize the space of users in a useful way. An approach that seems fairly effective is to do the following:
- find the most active or influential users
- find out who follows whom among that set of users
- create an adjacency matrix
- reduce that matrix to two dimensions using truncated SVD and t-SNE
- create a 2D visualization (e.g., like the one for users tweeting about healthcare included in this previous Civis post).
The t-SNE algorithm ends up grouping together similar users because it tries to put users with similar sets of friends and followers, as represented by the adjacency matrix, near to each other in 2D space.
The t-SNE algorithm (and scikit-learn’s implementation – open source for the win again!) is perfectly capable of finding a 3D manifold rather than a 2D one, so I tweaked our code to output a CSV file with x, y, and z coordinates for each of 1,000 users tweeting about data science, and then threw that into Blender. More precisely, I made a Blender scene with the appropriate camera settings and some basic lighting, and then ran the following code. (Note: the communities used for coloring data points are clusters extracted via the Louvain algorithm.)
import bpy
import csv
import json

# Open the empty base scene.
bpy.ops.wm.open_mainfile(filepath="stereo_equirectangular_base.blend")

elem_size = 0.1  # Make the points fairly small.
alpha_level = 0.25  # for transparency (though, I'm not sure this works below...)
input_path = "datascience_twitter_users_3d_tsne_with_communities.csv"

# Make materials for coloring data points.
# http://wiki.blender.org/index.php/Dev:2.5/Py/Scripts/Cookbook/Code_snippets/Materials_and_textures
def make_material(name, diffuse, alpha):
    mat = bpy.data.materials.new(name)
    mat.diffuse_color = diffuse
    mat.alpha = alpha
    return mat

# Make different colored materials for each community.
with open(input_path) as csvfile:
    reader = csv.DictReader(csvfile)
    communities = {row['community'] for row in reader}

# Load a color scheme from http://colorbrewer2.org/.
all_colors = json.load(open("colorbrewer.json"))

# Make materials for the different groups of points.
colors = [[float(v) / 255 for v in x[4:-1].split(',')]
          for x in all_colors['Set3'][str(len(communities))]]
materials = {}
for community, rgb_tuple in zip(communities, colors):
    mat = make_material("mat_{}".format(community), rgb_tuple, alpha_level)
    materials[community] = mat

# Position and color the points.
with open(input_path) as csvfile:
    reader = csv.DictReader(csvfile)  # no pandas in blender (by default) :-(
    for row in reader:
        x, y, z = float(row['x']), float(row['y']), float(row['z'])
        bpy.ops.mesh.primitive_uv_sphere_add(location=(x, y, z))
        ob = bpy.context.object
        ob.data.materials.append(materials[row['community']])
        for face in ob.data.polygons:
            face.use_smooth = True
        bpy.ops.transform.resize(value=(elem_size, elem_size, elem_size))

bpy.data.scenes['Scene'].render.filepath = 'stereo_3d_tsne.png'
bpy.ops.render.render(write_still=True)

# Save the modified file.
bpy.ops.wm.save_as_mainfile(filepath="modified_stereo_equirectangular_base.blend")
The output is another stereoscopic equirectangular image that can be loaded up in Gear VR, but since not everybody has a VR headset (yet!), I’m also including the next best thing, an animated GIF (the frames were rendered by adding some camera movements to the modified scene) that almost captures the excitement of being immersed in the data science social network through VR.
Some Parting Thoughts
Is that stereoscopic 3D image (or the animated GIF version) a useful visualization? No, of course not. It doesn’t even have a way to show who’s who, or who’s connected to whom, etc. Nor can one search for particular users, or then click on nodes to see Twitter profiles, tweets, etc.
However, the sense of immersion in the VR visualization does seem to have some intangible value, like you can reach out and touch the data, though I won’t go into it for fear of sounding completely nuts. Moreover, there is potential to convey visual information more efficiently in a 360-degree wraparound 3D medium than on a flat 2D screen. From the data science and analytics perspective, imagine an immersive VR dashboard: it would be like having 20 big screen TVs surrounding you (How else are you going to view all your Big Data?). OK, maybe that’s a bit much, but hopefully you can imagine the possibilities.
It’s hard to say where VR will take us. In the short term, while it looks like some the technical tools needed to make virtual reality data science applications are in place (e.g., the Oculus APIs, Unity, and open source tools like Blender), there are a ton of usability issues that need to be figured out, and it’ll be a while before frameworks built specifically for data visualization show up (e.g., like D3.js for VR). However, the future is bright… and putting on a VR headset makes you think you’re already living in it.

Notes on setting up a Blender scene for stereoscopic equirectangular rendering.
Select “Cycles” Render” in the “Info” editor (at the top of the screen by default)
In the “Properties” editor…
- Go to the “Render Layers” tab
- Check “Views” (and the default should be Stereo 3D)
- Go to the “Render” tab (still camera icon)
- Set the “Views Format” to Stereo 3D, with Stereo Mode as “Side-by-Side” (or “Top-Bottom”)
- Set the image resolution such that X = 2 * Y (and 100%)
Select the camera and…
- Go to the “Data” tab (the video camera icon)
- Select the “Panoramic” Lens with “Equirectangular” as the type.
- Select “Toe-in” under “Stereoscopy”.
- Select “Center” under “Pivot”
Go to the compositing interface (drop down in info bar) and…
- In the node editor, check “Use Nodes”
- replace the “Composite” node with a “File Output” node
There’s a lot more details and ideas in the blender documentation and on forums.